
Uptime monitoring that explains the outage.
Most monitors tell you a site is down. Vigil checks your sites, pages, links and ports every minute, then uses AI to work out why, and emails you the likely cause and the first fix.

What AI changes about monitoring.
Every check is still a real request with a clear pass or fail. AI adds the part a traditional monitor leaves to you: understanding what went wrong.
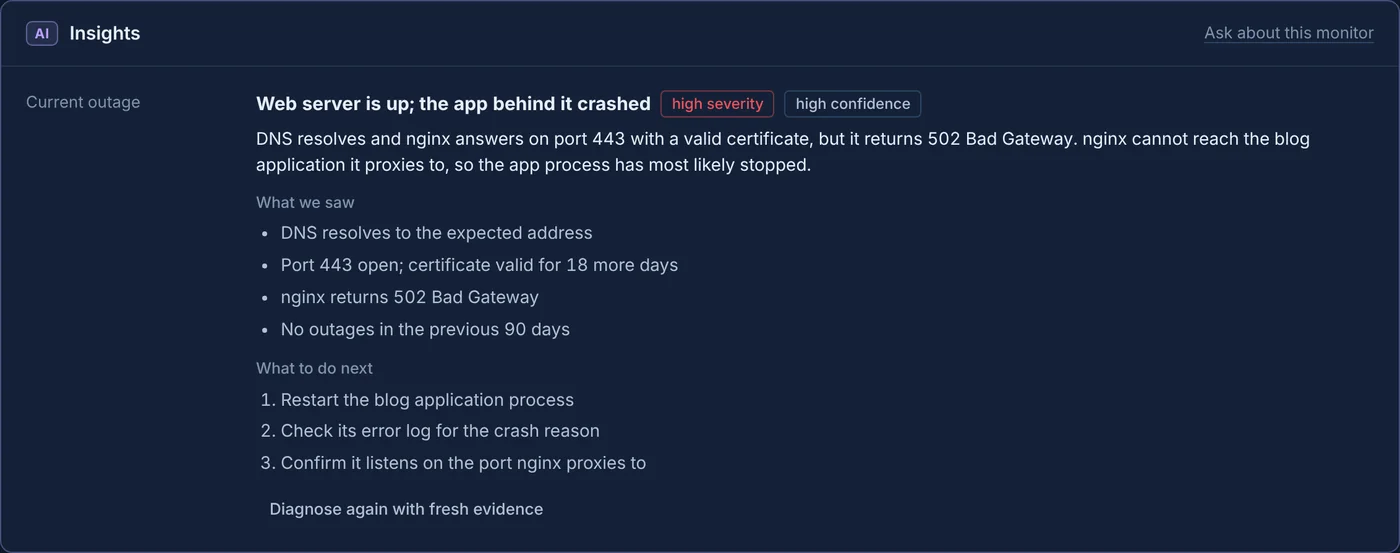
Every outage arrives with a diagnosis.
The moment a failure is confirmed, Vigil looks around: DNS answers, open ports, the web server’s reply, the certificate and the page itself. AI reads that evidence and tells you what most likely broke and what to do first.
- Severity and confidence, so you know how much to trust it
- Included in the email, Slack or Discord alert
- Run it again with fresh evidence at any time
It notices when a page is wrong, not just down.
A maintenance banner, a database error or injected spam still returns 200 OK, so ordinary monitors call the site up. The AI page check reads what visitors see and compares it with your own description of a healthy page.
- Instant, free rules for common error and parked pages
- Runs only when the page content changes
- Mark it healthy if you disagree
The page answers 200 OK but shows a maintenance notice instead of the booking form.
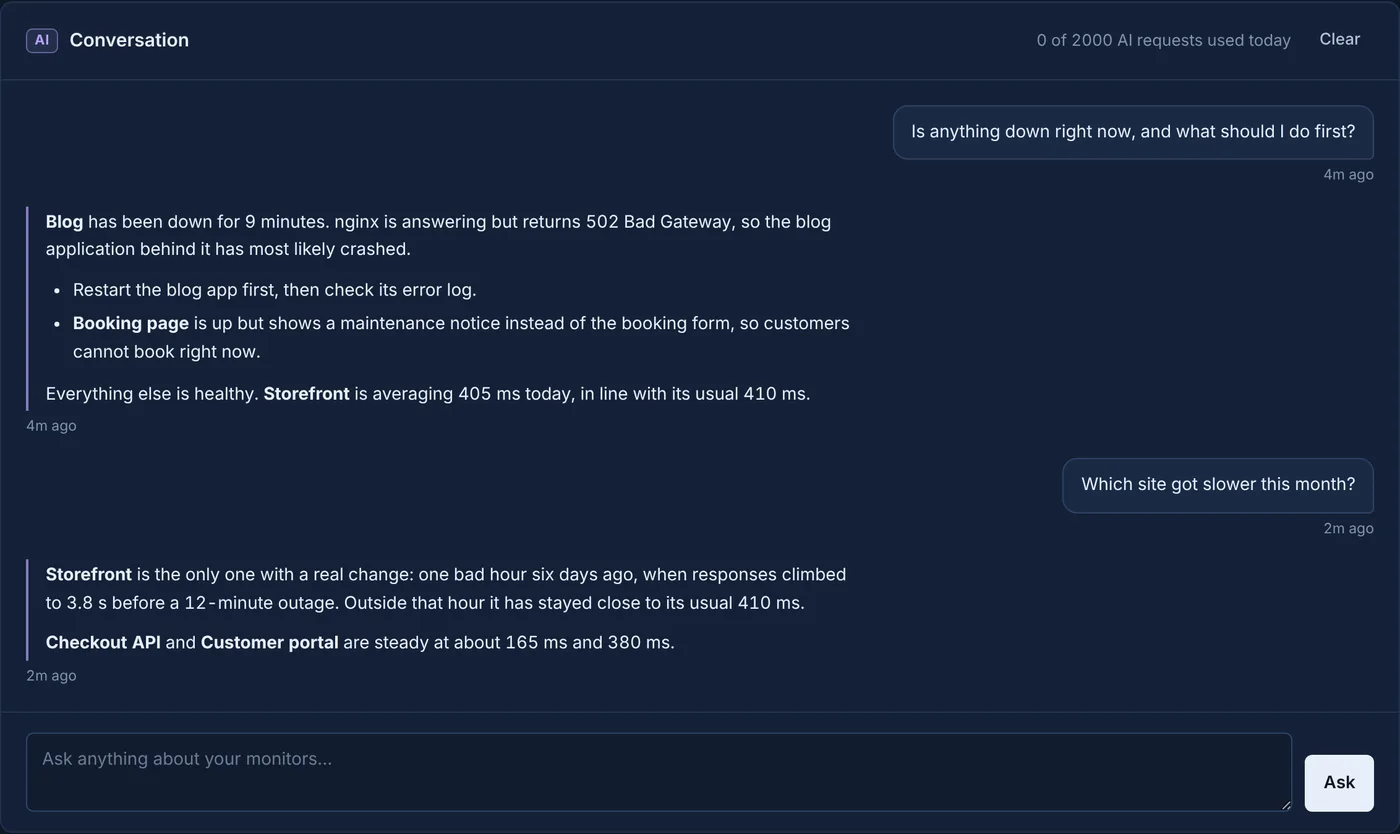
Ask your monitoring anything.
The assistant sees all your monitors, this week’s checks and the last 30 days of incidents with their diagnoses. Ask in your own words and get an answer with names, numbers and times.
Once a week it also writes a short reliability report and emails it to you.
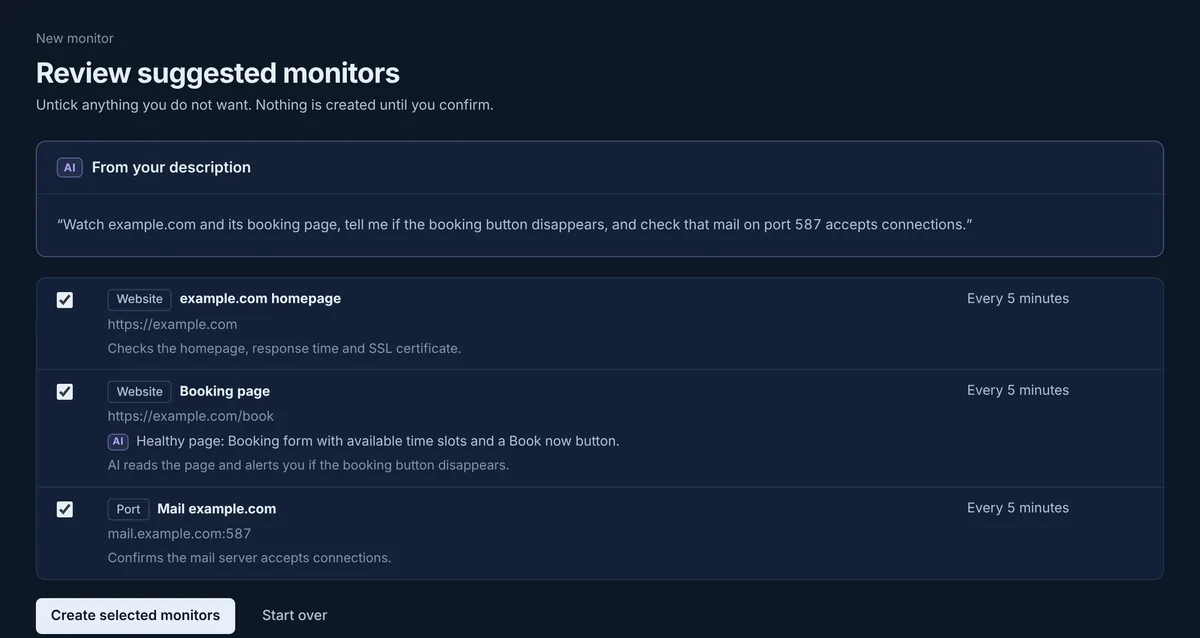
Describe it instead of configuring it.
Write what you want watched in a sentence. AI proposes the monitors, including what a healthy page should show; you review and create them.
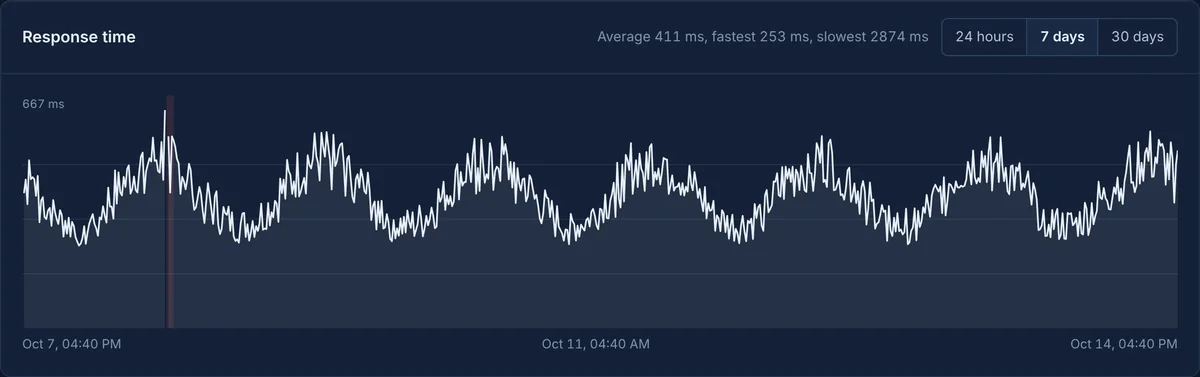
Knows what slow means for each site.
Every monitor learns its own normal response time. When a site becomes far slower than usual, you hear about it, without guessing a threshold first.
What happens when a site goes down.
Check
We request your site on schedule, every 30 seconds to every hour, the way a visitor's browser would.
Confirm
A failed check is retried right away. A single dropped packet does not page you.
Diagnose
AI probes DNS, ports, the web server, the certificate and the page, and compares with the site's history.
Alert
Email, Slack, Discord or webhook, with the likely cause and next steps included.
Recover
You hear when it is back, and the outage is logged with its cause and duration.
Every check a monitor should do.
Add a URL and pick what to watch. Each monitor keeps its own history, incidents and alert settings.
Websites and APIs
Status codes, response time and redirects. Add text the page must show, or let AI judge whether the page looks right.
SSL certificates
Every HTTPS check reads the certificate. You get a warning days before it expires, and an alert if it is invalid.
Broken links
Scan a page for links, images, scripts and stylesheets. We list each one that returns 404 or fails, with the exact URL.

Ports and DNS
Confirm mail, database or SSH ports accept connections, and that DNS records still point where they should.
Give customers a page to check before they email you.
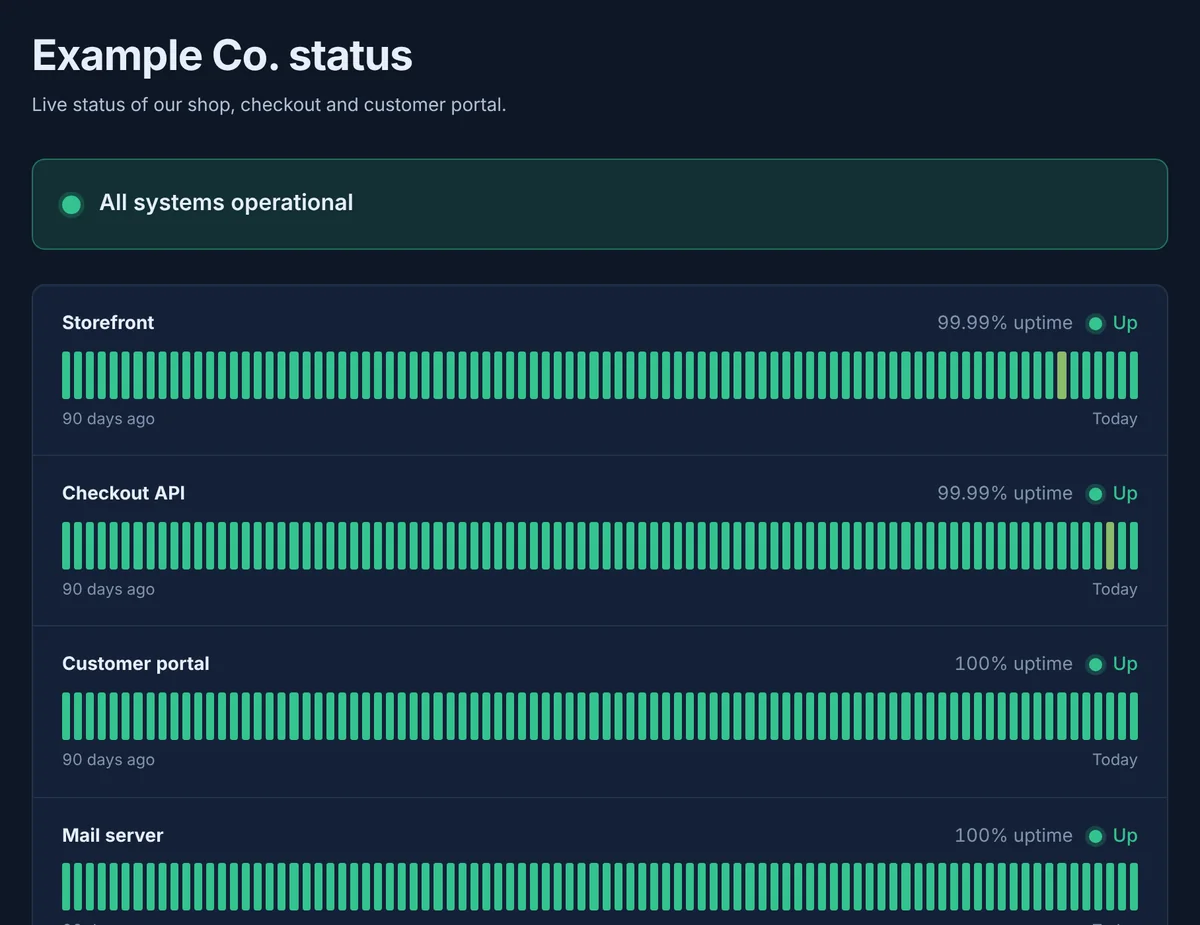
Publish a status page for any group of monitors. It shows current state, 90 days of uptime and recent incidents, and updates itself.
Pricing that grows with the number of sites.
Start free. Every plan includes AI incident diagnosis, email alerts, SSL warnings and a public status page.
Starter
For a personal site or a side project.
- 5 monitors
- Checks as often as every 5 minutes
- 30 days of check history
- 1 public status page
- 2 alert contacts
- AI diagnosis, page checks and assistant (15 AI requests a day)
- SSL expiry warnings
- Email, Slack, Discord and webhook alerts
Pro
For businesses that cannot afford to be offline.
- 50 monitors
- Checks as often as every 1 minute
- 90 days of check history
- 5 public status pages
- 10 alert contacts
- AI diagnosis, page checks and assistant (200 AI requests a day)
- Broken link scans
- SSL expiry warnings
- Email, Slack, Discord and webhook alerts
Agency
For agencies watching many client sites.
- 250 monitors
- Checks as often as every 30 seconds
- 180 days of check history
- 25 public status pages
- 50 alert contacts
- AI diagnosis, page checks and assistant (1000 AI requests a day)
- Broken link scans
- SSL expiry warnings
- Email, Slack, Discord and webhook alerts
Questions
What does the AI actually do?
When a monitor fails, it gathers evidence (DNS answers, which ports respond, the HTTP status and headers, the certificate, the page text and recent history) and explains the most likely cause with next steps. It also reads monitored pages for problems a status code cannot show, learns each site's normal speed, answers questions about your monitors, writes weekly reports, and turns a plain-English description into monitors.
Does AI replace the normal checks?
No. Every check is a real request with a clear pass or fail rule, so alerts never depend on AI. AI adds explanation and catches problems that rules cannot see.
Which AI models do you use, and what is sent to them?
Models from leading providers, through OpenRouter. Only what a feature needs is sent: for example the page text for a page check, or the check results and probe findings for a diagnosis. Account passwords and alert contacts are never sent.
What counts as down?
A request that times out, cannot connect, fails the SSL handshake, returns a status code you did not expect, or is missing the text you asked us to look for. Each failure is retried before we raise an alert.
How do alerts reach me?
By email, and optionally through Slack, Discord or a webhook to any system you use. Each monitor can alert a different set of contacts.
Can I change plans later?
Yes. Your monitors, history and status pages carry over when the plan changes.

Get some sleep. We will keep watch.
Add your first site in under a minute. If something breaks overnight, the alert will already say why.